Executive Summary
The Problem: The dealership lacked a
centralized reporting system to monitor sales
performance, profitability, budgets, discounts, and
customer purchasing trends across multiple years and
sales channels. Decision-making relied heavily on
manual reporting and fragmented datasets. Solution
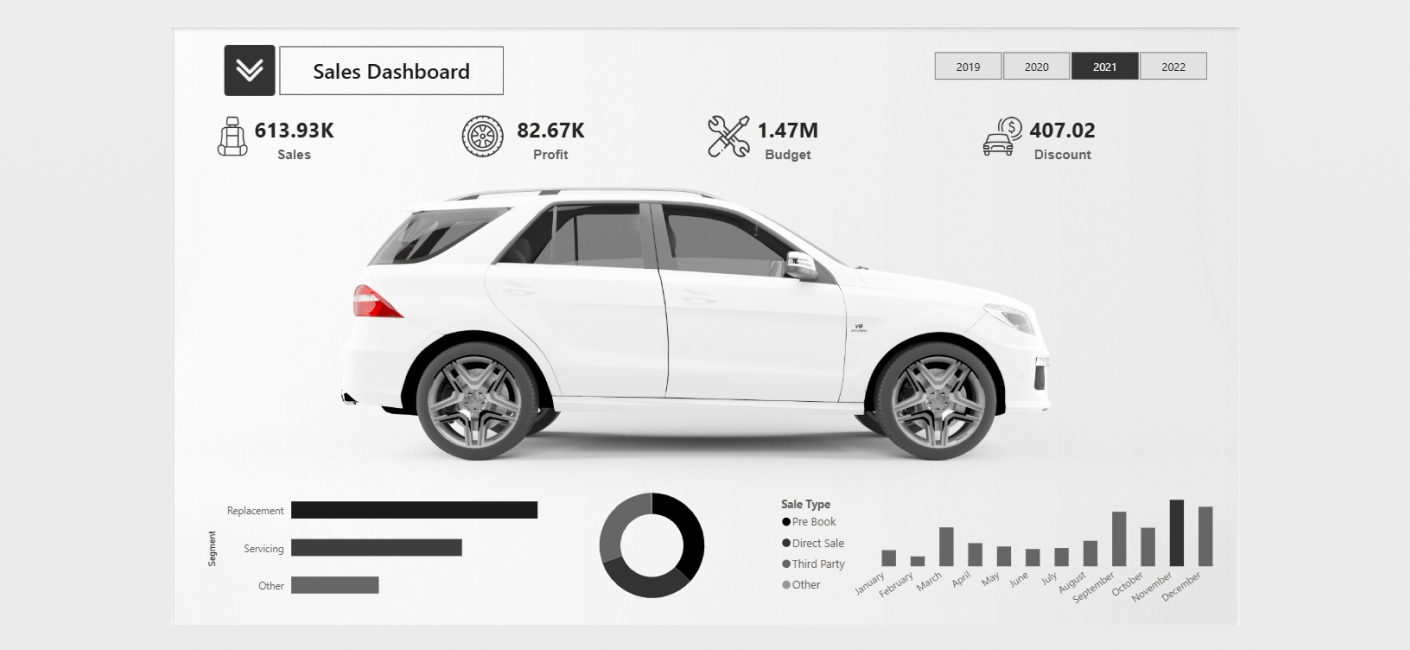
Designed and developed an interactive Power BI
executive dashboard that consolidated sales,
operational, and financial data into a single business
intelligence platform with dynamic filtering and
visual analytics. Business Impact Enabled faster
executive decision-making, improved visibility into
profitability and operational performance, identified
sales trends and channel effectiveness, and supported
strategic business planning through data-driven
insights.
The Challenge:The automotive
dealership generated large volumes of operational and
financial data but lacked a centralized business
intelligence solution capable of transforming this
information into actionable insights.
Management faced several challenges:
- Difficulty tracking overall sales performance.
- Limited visibility into profit margins and budget utilization.
- Inability to quickly identify top-performing sales channels.
- Challenges understanding customer purchasing patterns.
- Lack of historical trend analysis for forecasting.
- Time-consuming manual reporting processes.