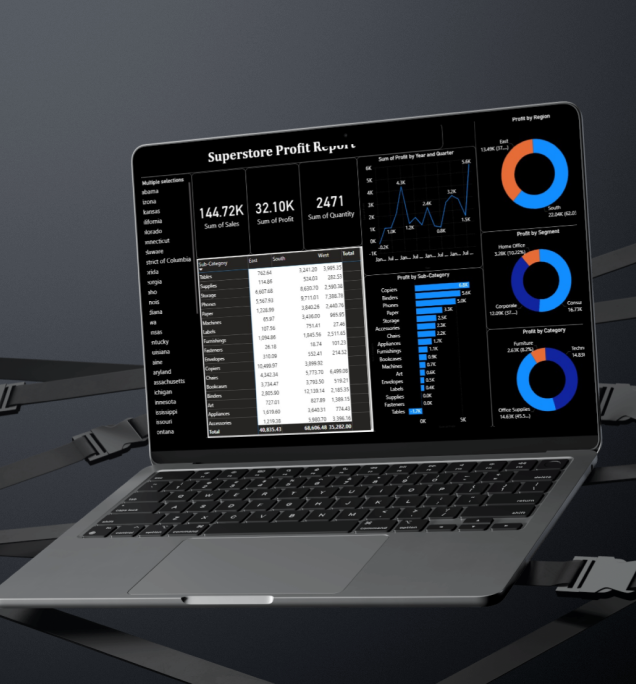
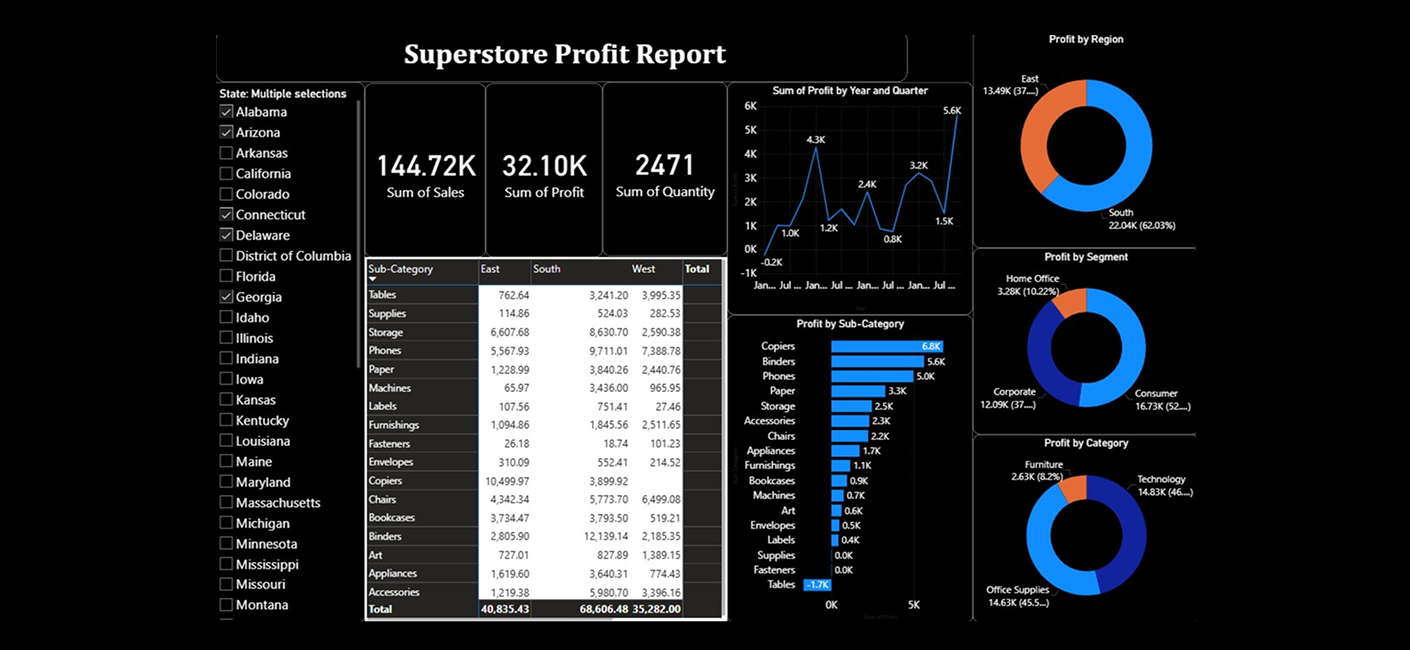
Executive Summary
The Problem: Retail businesses
generate thousands of transactions across products,
regions, and customer segments, making it difficult to
identify profitability drivers and underperforming
areas using raw data alone. Solution Developed an
interactive Power BI profit analytics dashboard that
transforms transactional retail data into actionable
insights through dynamic filtering, profitability
analysis, and visual storytelling. Business Impact
Enabled rapid identification of profitable regions,
customer segments, and product categories while
demonstrating how effective visualization can
accelerate data-driven decision-making.
Project Context:Most of my
professional Power BI work involves exploratory data
analysis (EDA), operational analytics, and executive
reporting on datasets that are confidential due to
organizational sensitivity. As a result, I
periodically undertake publicly available or sample
projects such as this one to demonstrate my analytical
approach, dashboard design philosophy, and the
importance of effective data visualization. This
project serves as an example of how business
intelligence tools can transform complex transactional
data into intuitive visual insights that support
strategic decision-making.
The business required answers to several important
questions:
- Which geographical regions generate the highest profit?
- Which customer segments contribute the most to overall profitability?
- Which product categories drive business growth?
- Which sub-categories underperform and require attention?
- How does profitability change over time?
- What opportunities exist to optimize business performance?